What we found

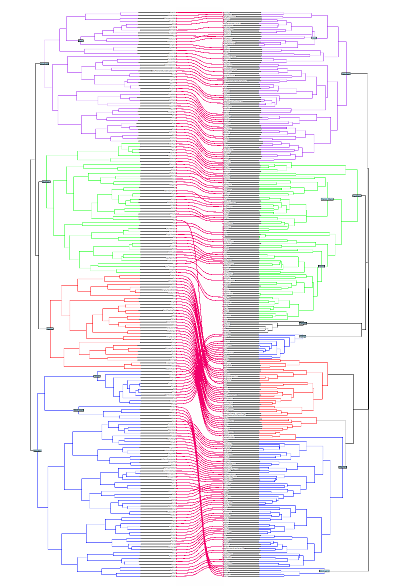
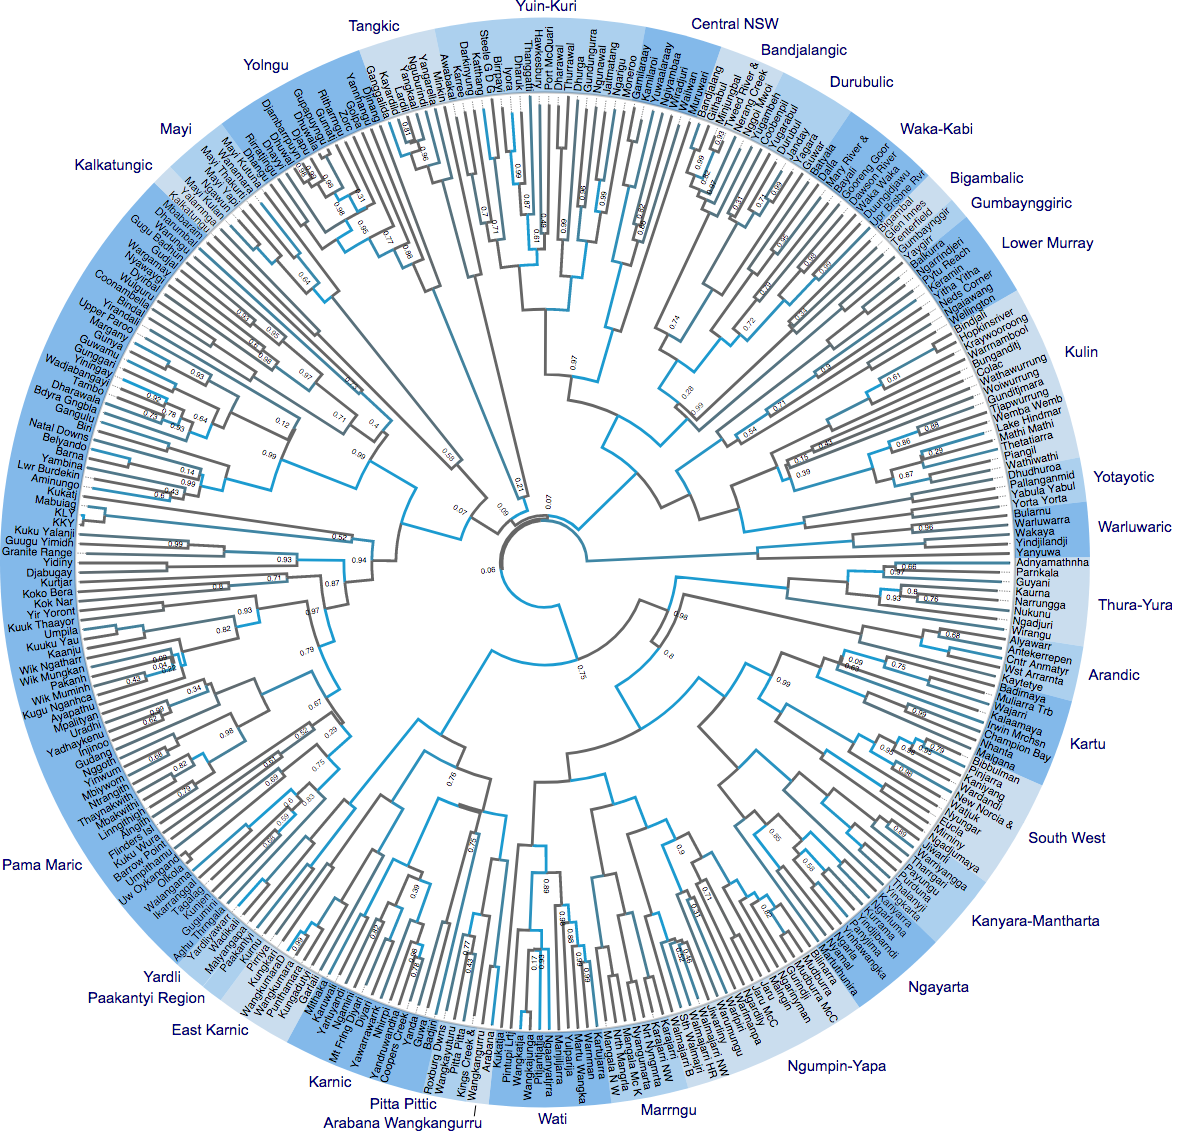
Below is a summary tree, which shows the best-supported relationships within the Pama-Nyungan family, as well as attempting to capture uncertainty in the distribution of trees. There are 306 languages, grouped into 31 sub-families as shown by the labels outside the circle. The colour of the branches is dark grey when there is no movement, and light blue when migration happens at faster rates. Numbers at split points indicate how much posterior support there is for the grouping, but the number is left out when there is 100% support. Note the low support values near the root of the tree, and rather high values near the leaves of the tree. That is, the closer we get to the present, the more confident we are about what the subgrouping is.

Tracing back down the branches of the tree, we can infer the likely location in time and space of Proto-Pama-Nyungan (the common ancestor of the Pama-Nyungan languages in our sample). This is depicted visually in our Figure 1, below. Most of the points fall in the rapid replacement (red – H1) area, and there is some support for the early Holocene (yellow – H2) hypothesis, but very little support for post ACR (green – H3) and none for initial colonisation (blue – H4) hypothesis. The inferred age of the root of the tree also fits with H1. And when the location and timing information is combined, our analysis finds that the origin of H1 is orders of magnitude more likely than any of the other hypotheses.

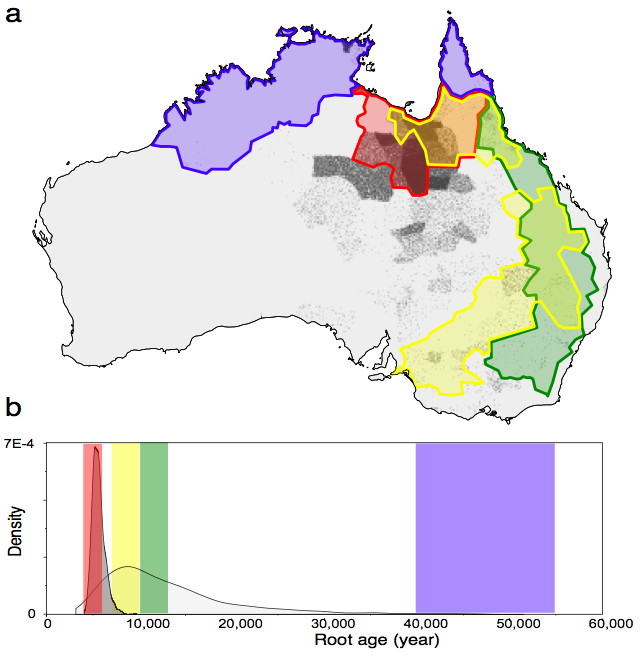
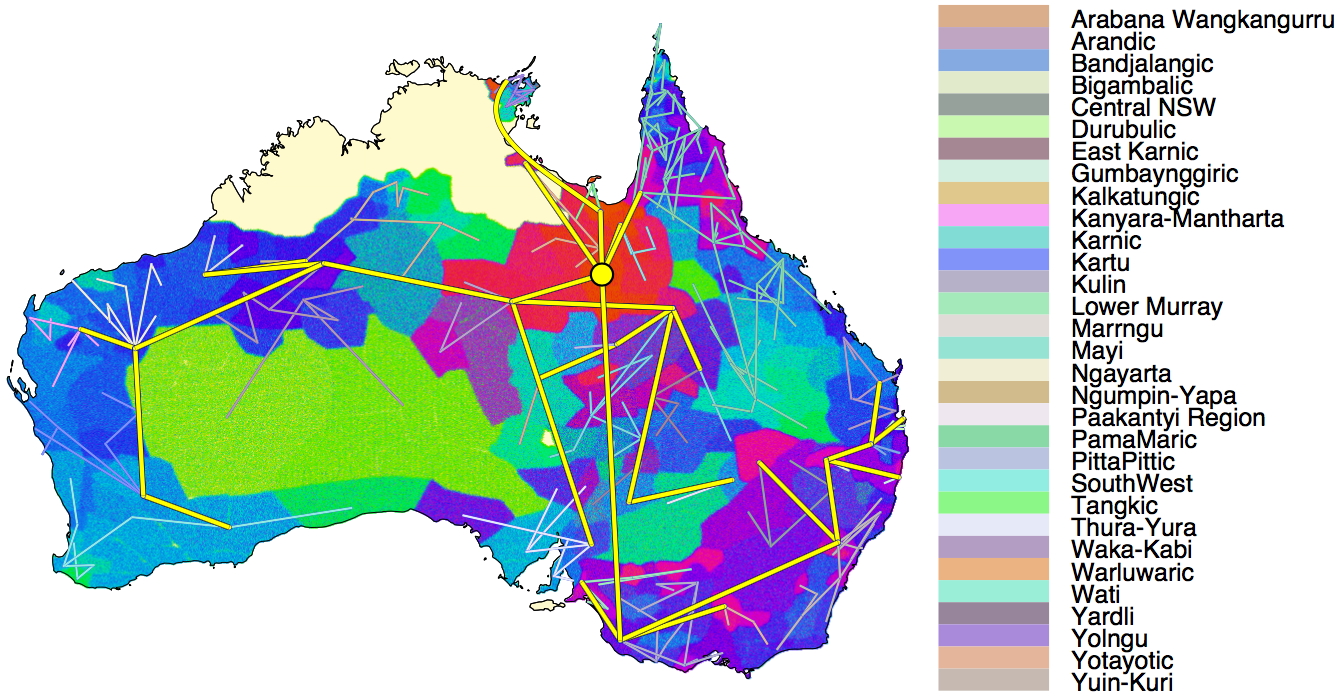
Hence, our analyses support an origin of Pama-Nyungan 5,000 to 7,000 years ago originating from just south of the Gulf of Carpentaria and consistent with the rapid replacement, H1, scenario. in agreement with Hypothesis 1. What can our model say about what happened since that time? The image below allows us to visualise these results.

It contains a projection of the summary tree on the map of Australia starting at the big yellow dot, which represents the origin. The yellow branches represent migrations above the sub-family level. Thinner lines are for migrations within sub-families. We see a rapid expansion covering most of of the regions containing Pama Nyungan languages. Colours of language regions indicate the time of first arrival: red is earlier, green is later and blue is in between.

Did the Pama-Nyungan languages expand more quickly in areas near water?

Our main analyses allowed rates of migration to vary across the history of the family, but did not systematically model variation in rates linked to the landscape. Recent work using Australian genomic and mitogenomic data indicates gene flow occurred preferentially along the coast and waterways, perhaps reflecting barriers to movement across more arid areas. To accommodate and test for this possibility, we fitted a series of models in which migration near water (oceans and rivers) was up to 10x faster or up to 10x slower than in the interior. The best fitting model was for the rate to be 2x slower near water. This suggests an interesting discrepancy with the genetic data, but one that is possible to reconcile. Individual people (and their genes) seem to move more rapidly between groups near water, perhaps because water facilitates the mobility between neighbouring groups. Conversely, languages appear to move more slowly near water, perhaps because conditions of relative abundance near water promote sedantism, whilst groups in arid regions need to range over large areas. Thus, proximity to the coast and waterways is linked to increased gene flow but reduced rates of language migration. Regardless, this landscape aware model did not change support for hypothesis 1 – the rapid replacement hypothesis

How robust are our findings?

The results presented in these figures were based on the best fitting models. To make sure that our findings did not depend on a particular combination of model assumptions, we repeated these analyses under a range of different models and data. In addition to evaluating the effect of different rates of migration near water, we also considered a model in which rates were equal in both descendent lineages. Analyses with different models of cognate evolution pointed to a younger root age, supporting hypothesis 1 as well. That is, the choice of model affects the very precise details of some of the results, but not the key findings.

To establish whether the analysis is sensitive to cognate judgements, we randomly ‘switched’ up to 15% of the data. All analyses still pointed to support for hypothesis 1.

To find out whether the analysis is sensitive to cognate judgements, we randomly replaced up to 15% of the 1s with 0s, thus simulating false negatives. Also, we randomly merged cognate columns so that up to 15% of the present cognates were affected, thus simulating false negatives. All analyses pointed to support for hypothesis 1.

How do these results relate to those in the Bowern & Atkinson 2012 Language paper?

In this paper, 111 out of 306 extra languages were included, and a timing calibration was performed. Also, we include geographical data to the analysis, so now we are able to pinpoint the geographical origin of Pama Nyungan languages.

When comparing the summary trees in a tanglegram – connecting languages from the summary tree of the 2012 paper with that of our current analysis – we see that the trees broadly agree on groupings at the lower and middle level, but that some changes higher up in the tree near the root would be required to get full agreement. Note that these are just summary trees, but that the outcome of these analyses are tree distributions (like shown Step 3 of what we did), and that uncertainty of the splits near the root is very high, both in our current and the 2012 analysis. More detail on the remaining small differences can be found in the Supplementary Note 2 of the paper.

Skip to toolbar